Overview
The numbers at the top of the spreadsheet had no labels. Only the owner knew what they meant.
The old First Contact Tracker was a system in the loosest sense — a yellow grid where new patients were numbered by hand each month, reset to one when the month turned, and entered however each staff member felt like entering them. Status updates lived in the notes column, when anyone remembered to write them. The totals couldn't really be trusted. Staff other than the original creator could barely read it, let alone act on it.
At the end of each month, the owner transferred the numbers manually into a separate spreadsheet just to see a graph.
The goal: Replace an informal, hard-to-trust spreadsheet with a structured intake pipeline the whole team could use and the owner could actually learn from.
The Challenge
The deeper problem wasn't the tallying. It was what happened in between. Staff working the old tracker regularly got stuck — who needs follow-up, how do we reach them, what's the next step? The sheet held data but gave no direction. A new inquiry looked the same as a stalled one.
Key gaps
- No defined follow-up stages — next steps lived in memory and scattered notes
- No conversion visibility — booking rates required counting by hand
- No referral source tracking — marketing spend with no way to measure return
- No year-over-year view — growth was a feeling, not a number
Approach
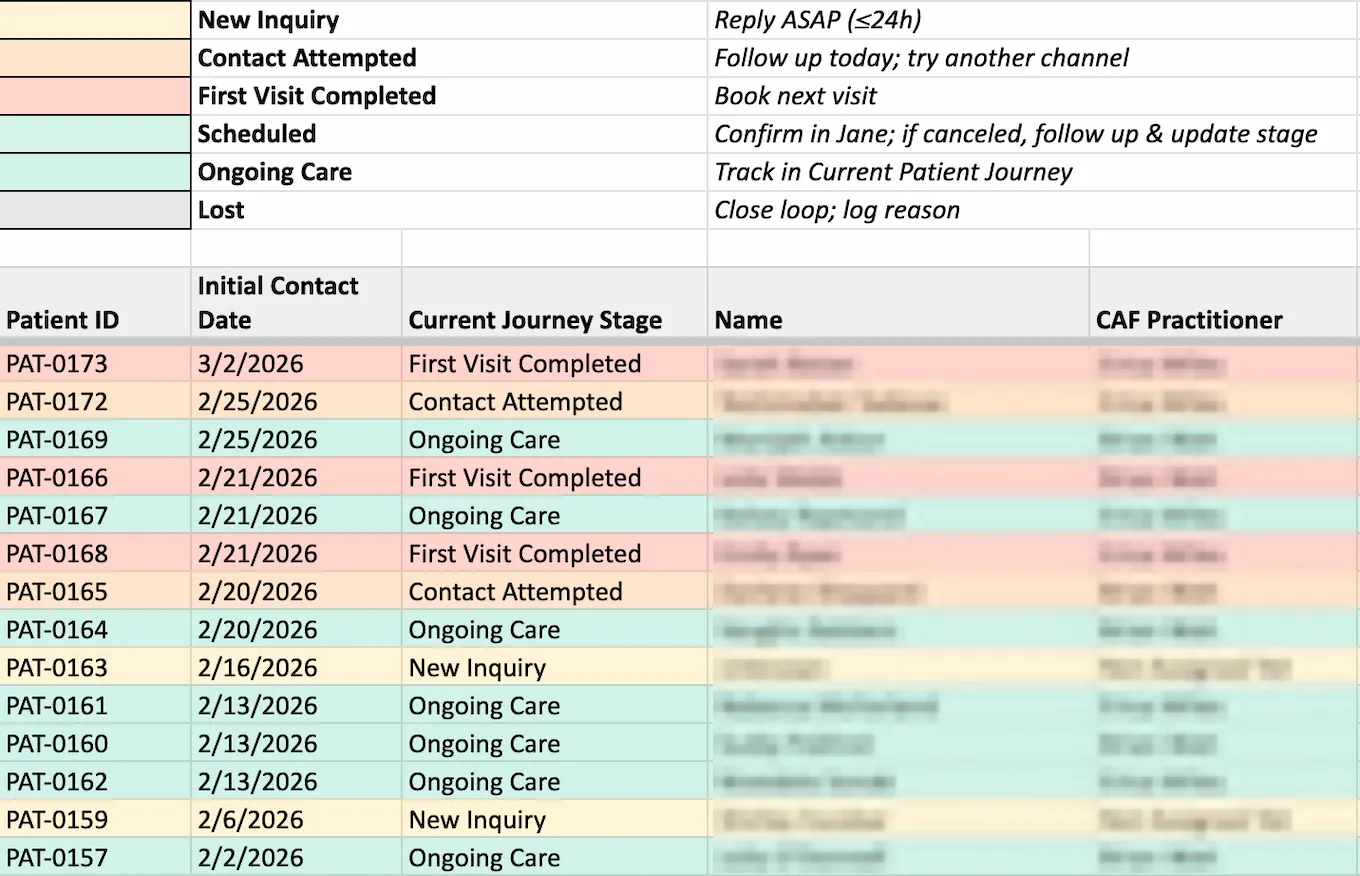
Every inquiry becomes a record with a defined lifecycle. Each patient moves through stages — New Inquiry, Contacted, Scheduled, First Visit Completed, Ongoing Care — with a color-coded view that makes the next action obvious. Staff no longer have to decide what to do. The stage tells them.
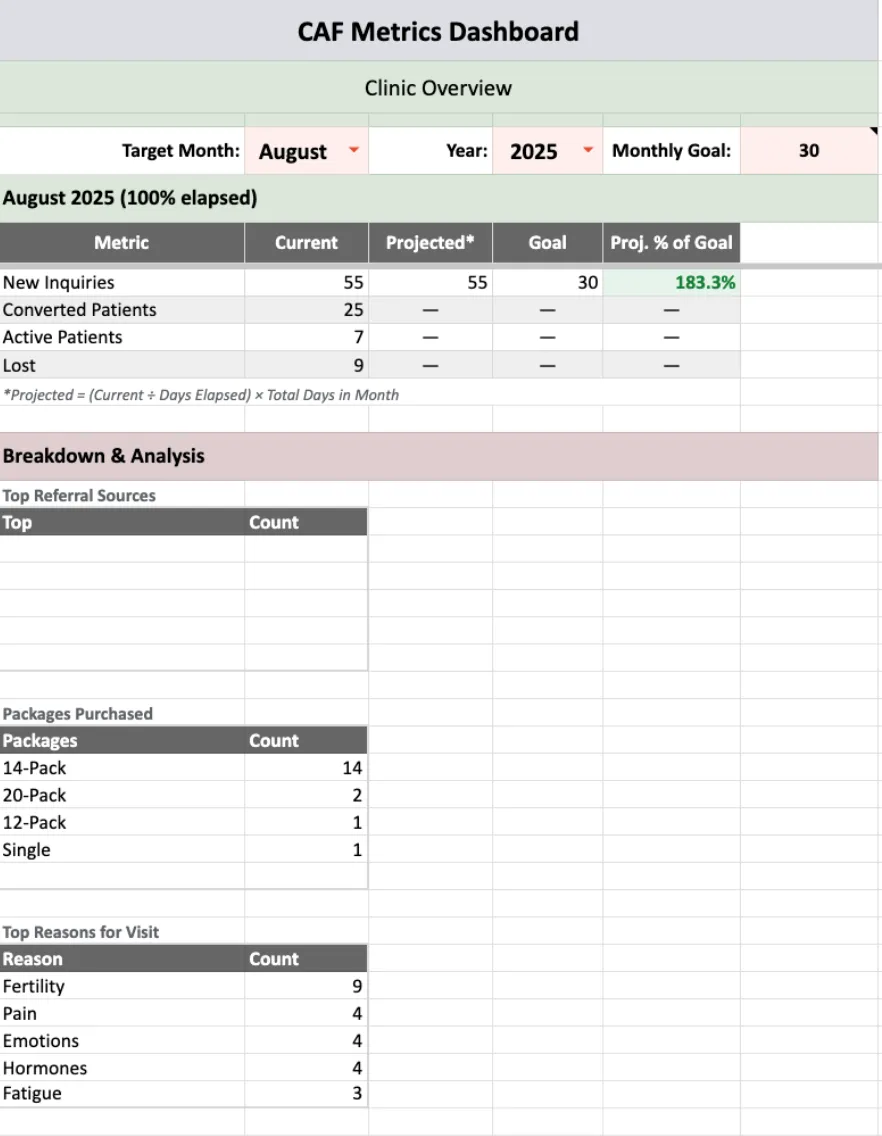
The dashboard runs live against that data. The owner selects a target month and sees current inquiries, projected pace, and a year-over-year comparison — without touching a calculator. What used to mean a separate spreadsheet and end-of-month tallying now updates on its own. The SEO contractor checks it to see whether his work is showing up in inquiry volume.
Reflection
The old system wasn't failing visibly. Staff were using it. The owner was working around its limits every month, transferring numbers by hand because that was just what you did.
The shift from gut feel to structured visibility is the same one a sales team needs when pipeline stops fitting in a spreadsheet.
The most useful thing here wasn't building the dashboard. It was showing someone who had always managed on instinct what it looked like to manage on information — and finding out they'd wanted that all along.